
Lexicon Financial Group Weekly Update — September 10, 2025
“When you look at a commodities market you need hedgers and speculators. If you don’t have one, you don’t have a market. That’s how it works.”
From the desk of Craig Swistun, CIM, MFA-P, Portfolio Manager, Raymond James Investment Counsel, and Wayne Hendry, Client Relationship Manager, Raymond James Investment Counsel
ISSUE 195
Looking Around
Every time you turn around, you’ll hear another investor or industry analyst say something like, “This time, it’s different.”
Saying this is about as useful as a wooden frying pan, because economic conditions are never exactly the same. Take today, for instance. There has never been a time in history when the U.S. was imposing massive tariffs on its trading partners and other countries, war was being waged in Eastern Europe and the Middle East, and China, India, and Russia were cozying up diplomatically and economically.
So.. yes, things are different. But not in the way it’s implied and how does that impact investments and behaviour?
Take commodities, for example. Year to date, gold, silver and platinum are up approximately 39 per cent, 46 per cent and 57 per cent, respectively.
Yes, precious metals are up! But, do you know what else is up on the commodity side? The price of coffee (as a commodity, which ultimately translates to what you pay) is up over 28 per cent year-to-date and almost 60 per cent year-over-year. If we had told you at the beginning of 2025 that one of the best investments you could make was to buy coffee futures, you would have written us off as crazy and told us our coffee was cold.
Commodity investing is notoriously risky because commodities can be extremely volatile. For example, today, the price of silver is hovering around US$41.23/oz. That sounds great, until you realize that in January 1980 (over 45 years ago) the price of one ounce of silver was $35.28. The market for silver bottomed out in the early 1990s, when you could buy an ounce for less than $4. Over the last 30 years, the price of silver has risen to about US$42 per ounce.
Gold has also had an impressive run lately, but it too has seen periods of volatility as it moves in and out of favour. Between September 2012 and 2022, the price of gold barely budged, from US$1781 per ounce to US$1661 per ounce. Today, it is trading at over US$3660 per ounce, thanks to impressive gains over the last five years.
But, stock markets have also delivered significantly impressive returns.
Here’s an interesting chart.
The S&P 500 to Gold Ratio tracks the ratio of the S&P 500 market index to the price of gold. The number tells you how many ounces of gold it would take to buy the S&P 500 on any given month. In September 2020, it would have taken 1.78 ounces of gold to purchase the S&P 500 index. Today, it would be slightly more expensive at 1.79 ounces.
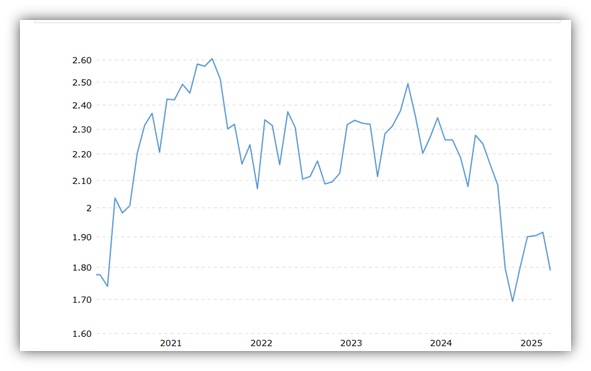
Source: Macrotrends
We’re not calling for a bubble here, but we’ve seen bubbles before. And some analysts have begun to allude to the possibility of gold and other precious metals becoming a speculative bubble. According to Timothy R. Burch, an Associate Professor of Finance at the Miami Herbert Business School, the hallmarks of a typical bubble are a rapid price rise, high trading volume, and word-of-mouth spread. Usually, a bubble is created out of sound fundamentals, but eventually, exuberant, irrational behaviour takes over, and the surge is caused by speculation, namely, buying for the sake of buying, in the hopes that prices continue to rise.
Bubbles are often driven by psychological factors such as greed, fear, herd behaviour, and recency bias (the tendency for people to overweight new information or events without considering the objective probabilities of those events over the long run) as well as by fundamental changes in the economy, technology or regulation. And, unfortunately, history is littered with bubbles. Just look at the graph below.
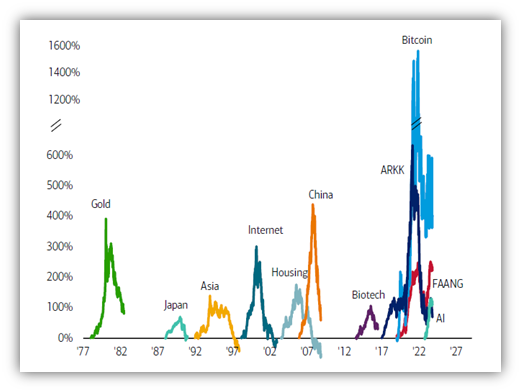
Source: BofA Global Investment Strategy, Bloomberg
Bubbles are usually followed by a sharp correction that erodes most of the previous gains. It can and does lead to the irrational investor behaviour that are characteristic of bubbles. (2)
Read and Watch
Want deeper insight into topics in your Weekly Update? Then, read and/or right click:
Donald Trump maelstrom likely to leave US economic model unrecognisable
Inflation in France, Spain and Italy was lower than expected in August, data shows
Japan confirms GDP growth as spending holds up amid U.S. tariffs
Looking Back
Canada’s main stock index, the S&P/TSX composite index (TSX) closed out last week up 1.7 per cent, thanks to gains for technology and gold mining shares as well as disappointing U.S. and Canadian jobs data spurred investors to raise bets on interest rate cuts. (3)
Most U.S. stock indexes finished the holiday-shortened week higher. These stock indexes were generally up through Thursday and opened higher Friday morning, following the release of some weaker-than-expected labour market data, which raised hopes that the Fed would lower short-term interest rates at its upcoming meeting next week. However, investor sentiment cooled and the indexes gave back their early gains, thanks in part to fears that rate cuts may not be enough to boost economic growth, as August’s unemployment rate also ticked up to 4.3 per cent, which is the highest since 2021.
Major stock indexes in the European Union (E.U.) ended last week mixed. The pan-European STOXX Europe 600 Index ended 0.17 per cent lower amid concerns about global growth after weak U.S. jobs data and a stronger euro. Headline inflation in the eurozone, however, ticked up in August to 2.1 per cent, which remains close to the European Central Bank’s (ECB’s) two per cent medium-term inflation target. Unemployment in the bloc eased to 6.2 per cent in July from 6.3 per cent. This matched a low last hit in November 2024.
Japan’s stock markets rose last week, as Japanese auto shares were boosted by the U.S. officially implementing a trade deal with Japan reached in July, which caps tariffs on most Japanese goods, including autos, at 15 per cent. In exchange for these lower tariffs, Japan has agreed to investments of USD 550 billion in the U.S., as well as granting U.S. producers greater access to many of its markets, including for rice and other agricultural products.
Chinese stock indexes declined, as investors pocketed gains after a recent rally. These indexes have surged since April, largely due to domestic liquidity rather than strong corporate earnings or an improving economy. On the economic front, indications are pointing to a broad slowdown in China’s economy, which is struggling with the threat of higher U.S. tariffs, a yearslong property downturn, and persistent deflation. Many economists believe that data in the coming months will confirm China’s growth slowdown and lead officials to roll out more stimulus to protect the economy during the current U.S.-sparked trade war. (4)
The opinions expressed are those of Craig Swistun and not necessarily those of Raymond James Investment Counsel which is a subsidiary of Raymond James Ltd. Statistics and factual data and other information presented are from sources believed to be reliable, but their accuracy cannot be guaranteed. It is furnished on the basis and understanding that Raymond James is to be under no liability whatsoever in respect thereof. It is for information purposes only and is not to be construed as an offer or solicitation for the sale or purchase of securities. Raymond James advisors are not tax advisors, and we recommend that clients seek independent advice from a professional advisor on tax-related matters.
What Was the Highest Price for Gold? Lauren Kelly, Investing News Network, September 10, 2025
5 Stages of A Bubble, Troy Segal, Investopedia, November 2, 2024
TSX adds to daily winning streak as weak data boosts rate cut bets, Fergal Smith, Reuters, September 5, 2025
Global markets weekly update - August jobs data signal weakening U.S. labor market, T. Rowe Price, September 5, 2025
SUBSCRIBE
If you’d like to automatically receive the Weekly Market Update by email, enter your email address in the box below.
We respect your privacy, and you can always remove yourself from the mailing at any time.
Looking to Learn?
If you want to know more about some of the topics we wrote about this week, just click on the links below:
Ranked: How Key Commodities Have Performed Since 2019
Do central banks really have more gold than US Treasury bonds?
Treasury yields jump on prospect of U.S. having to refund tariff money; 30-year yield tops 4.97%